HOUSEFLIES
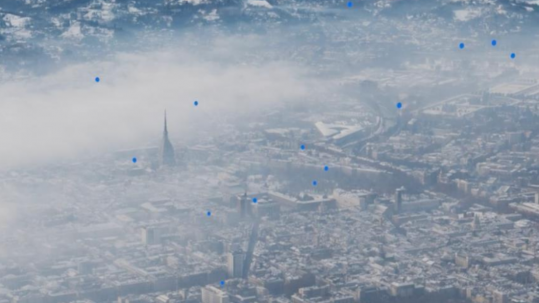
Project Title: HOUSEFLIES – Atmosphere and Clouds Seen by a Cluster of Flying Wireless Sensors Please see the P...


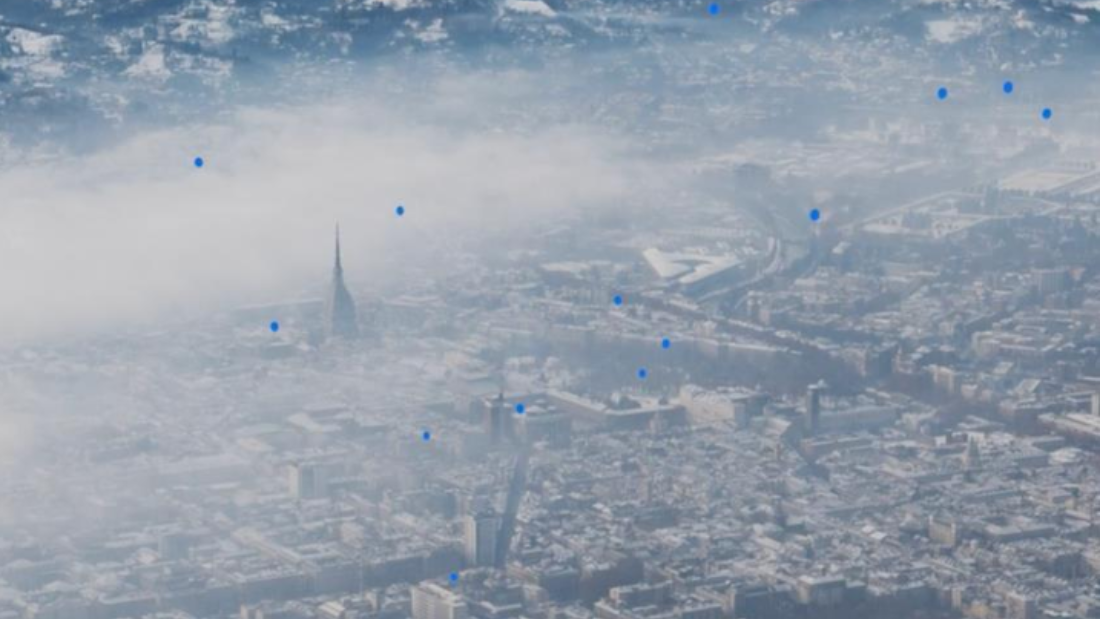
Project Title: HOUSEFLIES – Atmosphere and Clouds Seen by a Cluster of Flying Wireless Sensors Please see the P...

MIGRE MINI GREEN ULTRALIGHT EXPENDABLE RADIO SONDE Period: 01/03/2022 – 30/11/2022 Project Description The min...

EU Horizon 2020 COMPLETE – 675675 Marie Curie H2020-MSCA-ITN-2015 (2015) Marie Skłodowska-Curie Actions – In...

On March 6th, the Philofluid Research Group at Politecnico di Torino, coordinated by Prof. Tordella, hosted distinguishe...
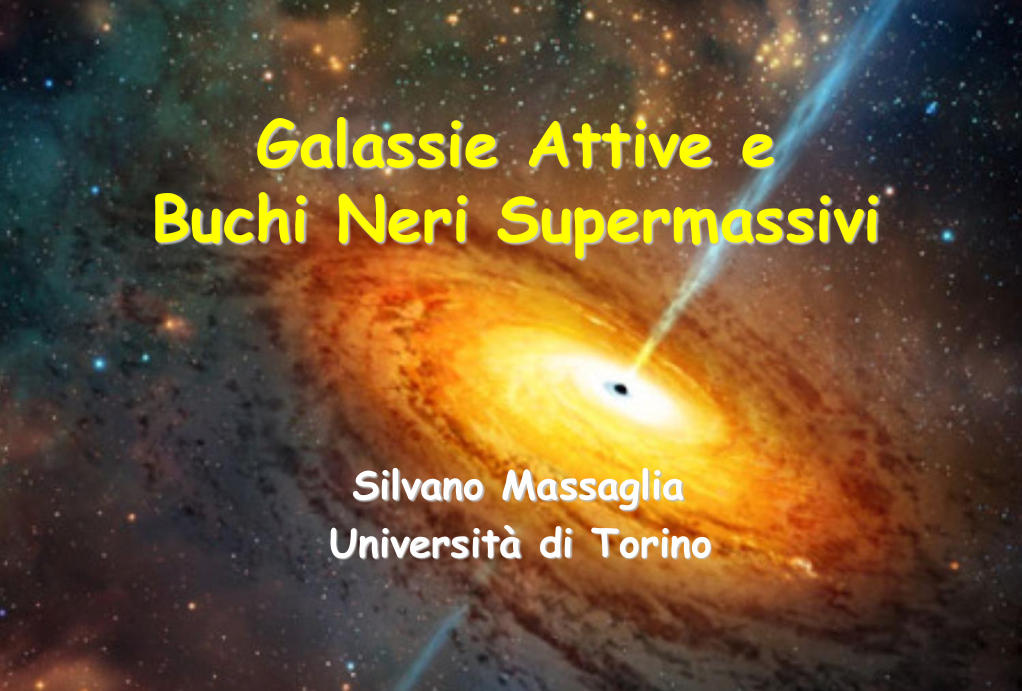
We were honored to attend an insightful seminar at Politecnico di Torino, led by Prof. Silvano Massaglia, coordinator ...
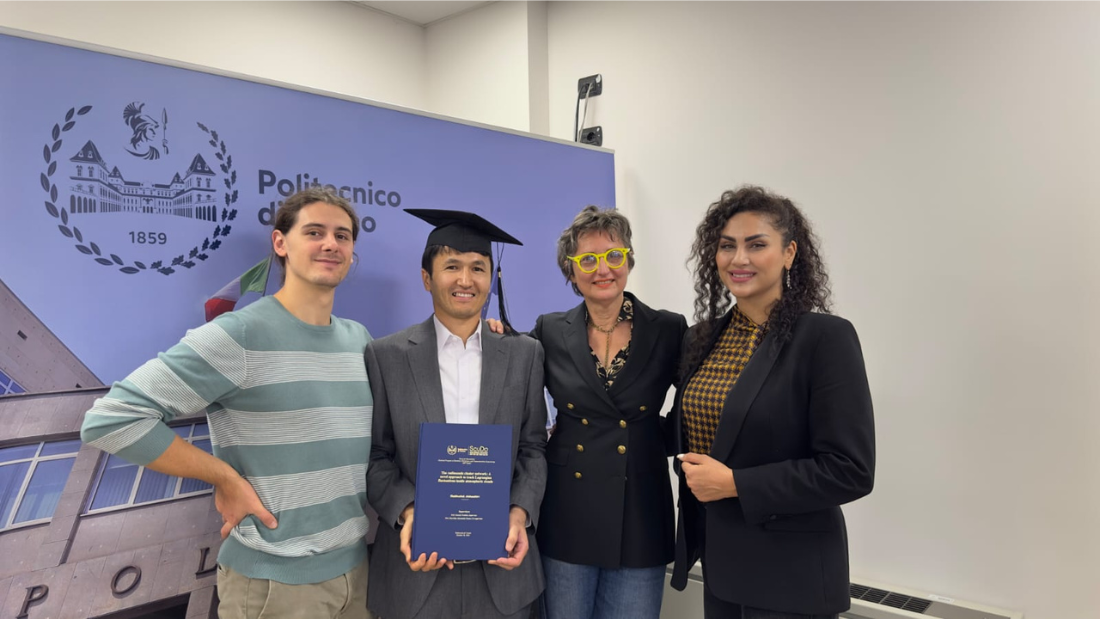
Exciting Milestone in the COMPLETE Project: Doctoral Dissertation Successfully Defended The Philofluid Research Group is...
Project Title: HOUSEFLIES – Atmosphere and Clouds Seen by a Cluster of Flying Wireless Sensors Please see the P...
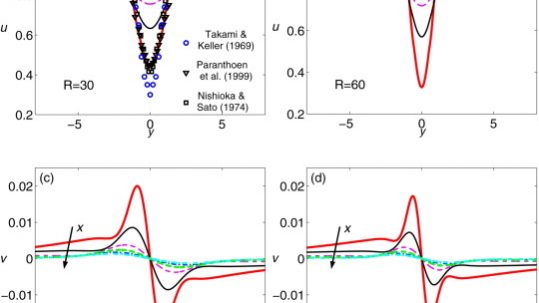
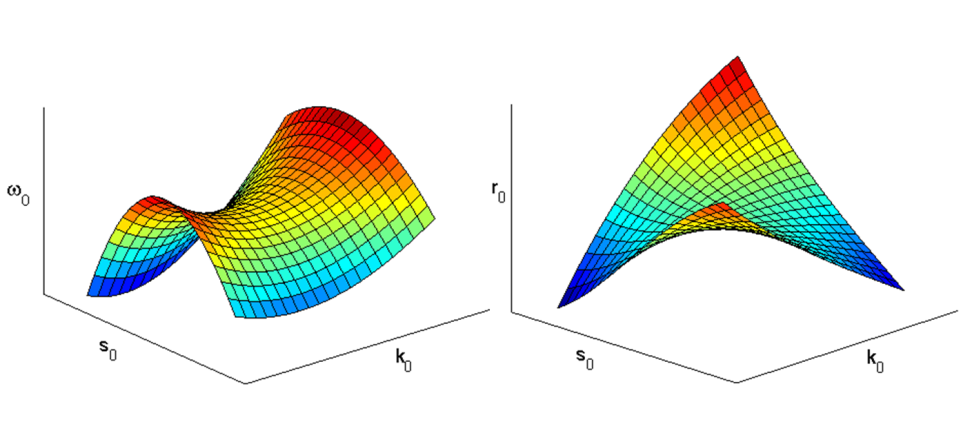
Dynamics of Laminar Thin Shear Flows An approximated Navier–Stokes steady solution has been presented for the two dimens...
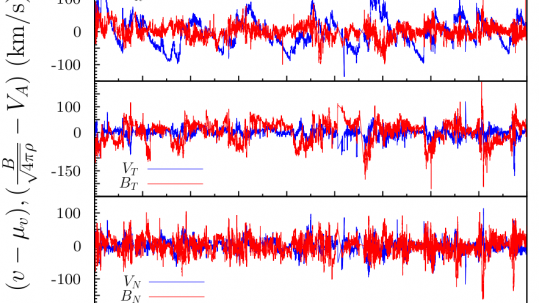
Solar-wind turbulence The NASA Voyager Interstellar Mission explores the outer heliosphere and its interaction with the ...
Notifications